How Can You Use Infographics to Engage Your Audience?
Have you ever seen a visual representation of data or information that is both informative and aesthetically pleasing at the same time? That’s an infographic, and it’s becoming increasingly popular in today’s digital age. Learn in this article why infographics are so effective – and how your business can use them to its advantage!
What are Infographics?
An infographic is a graphical way of displaying information. It is usually a combination of charts, graphs, and images to make complex data more understandable and visually appealing.
Infographics can be used in many different industries to explain data or statistics in a more digestible format. For businesses, infographics can be used to show customers or clients the company’s achievements, product benefits, or process improvements.
Some examples of where businesses might use infographics include:
- Explaining how a product works
- Showcasing customer testimonials
- demonstrating before and after results
- outlining the steps of a complicated process.
Infographics are an effective way to engage your audience and communicate information in a visually appealing way. When used correctly, they can help your business stand out from the competition and attract new customers or clients.
Types of Infographics
There are a few different infographics types, but they all have one goal in common: to make complex data more digestible and visually appealing. Here are some of the most popular types of infographics:

Data Visualization
These infographics use charts, graphs, and other visual elements to communicate data in an easily understandable way.
Timelines
Timelines are a great way to visualize progress or changes over time. They can be used to tell the history of a company or product or to show how a process works.
How-To Guides
Infographics can be used to create step-by-step guides that are easy to follow and understand. This is a great way to communicate complex information in a logical and straightforward way.
Comparisons
Comparisons are a great way to show relationships between different data sets. For example, you could compare the growth of two companies over time or compare the success rates of different marketing campaigns.
Get your Free 30 Minute strategy session with an experienced digital animators
Advantages of Infographics
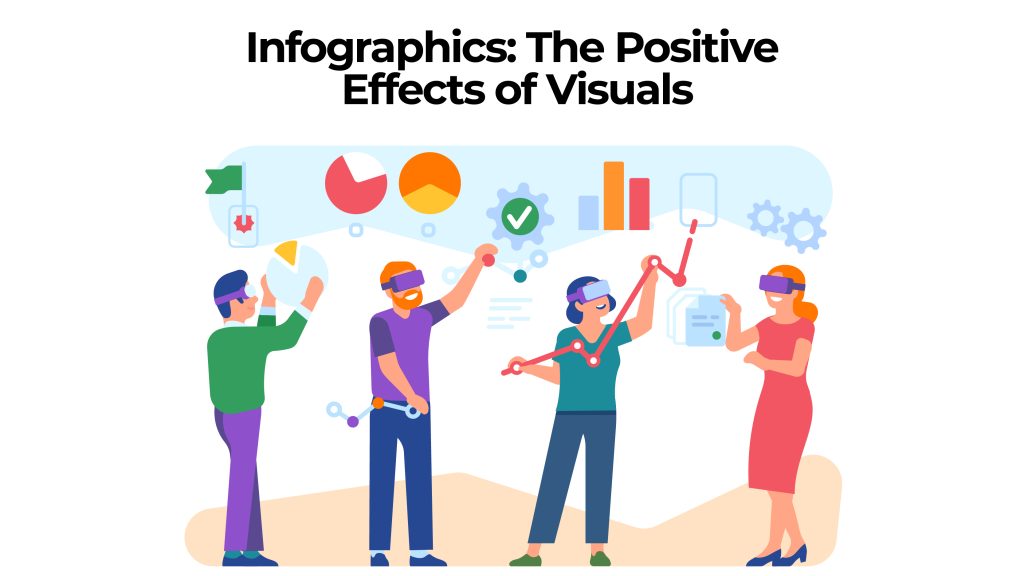
There’s no doubt that infographics are all the rage these days. And there’s good reason for it – they’re an incredibly effective way to communicate complex information in a visually engaging way. But what are the real advantages of using infographics? Here are just a few:
- Infographics are highly shareable. People love to share interesting and visually appealing content, and infographics fit that bill perfectly. In fact, infographics are often shared much more widely than traditional text-based articles.
- They’re great for SEO. Because infographics are so shareable, they can help you attract links and social media mentions from high-authority sites. This, in turn, can give your SEO a nice boost.
- They’re easy to digest. People have limited attention spans these days, so it’s important to communicate your message in a way that can be quickly and easily understood. Infographics do just that by breaking down complex information into bite-sized visuals.
- They’re memorable. Have you ever tried to remember a list of facts or statistics? It’s not exactly an easy task. But when those same facts are presented in an infographic, they’re much more likely to stick in your memory. So if you want your message to really resonate with your audience, an infographic is a great way to go about it.

Tips for Crafting Your Infographic
There are a number of tips to design the best infographic so that the information is conveyed clearly and the audience is kept interested. Some tips and tricks for making an infographic are as follows:
Define Your Target Audience
Choose whom you want to see your infographic before you start making it. This will guide your choices about the infographic’s tone, intricacy, and style.
Don’t Complicate Things
The most effective infographics are ones that get their point out quickly and simply. Don’t include too much language or data, and instead, on visual features to break down complicated topics.
Choose The Right Infographic Format
Infographics come in many forms, including flowcharts, timelines, comparison charts, and data visualizations, so it’s important to get this part right. Choose a format that works well with the message you wish to send.
High-quality Visuals
The images should be used of upright quality because they are the lifeblood of any infographic. Make your infographic more engaging by including high-quality images, symbols, and illustrations to back up your claims.
Keep it on the Brand
The visual identity of your brand, including colors, typography, and overall style, should be maintained throughout the infographic. To put it simply, this will aid in customer recall of your company.
Make It Shareable
Create a design that encourages others to spread the word: infographics tend to become viral after being shared on social media. Add sharing buttons, and think about adapting the size and shape to suit various channels.
Provide Context and Source
Information visualizations should be useful and credible, thus providing background and citations. To strengthen your argument’s credibility, be sure to provide background information and citations for all of the data you give.
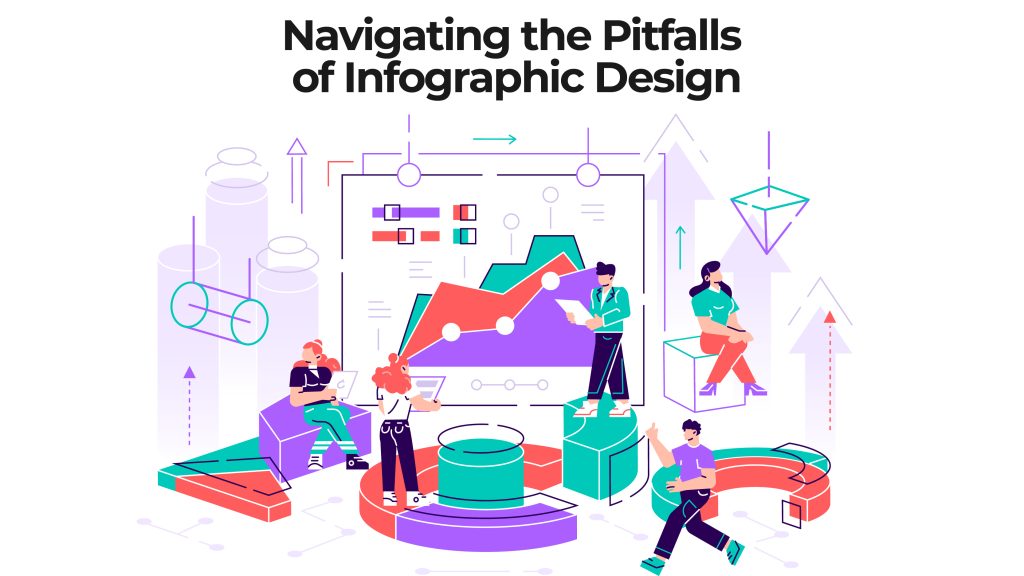
Some Pitfalls to Avoid for Creating Infographics
There are a number of common pitfalls that designers of infographics should avoid if they want their creations to do their intended job. Some pitfalls to avoid when making infographics are listed below.

Information Overload
Although infographics are supposed to convey data visually, too much data can detract from their intended purpose. If the infographic contains too much information or language, it may become difficult to read. Pay close attention to highlighting the most vital points.
Lack of Consistency
Inconsistency is a common issue with infographics, and it’s important to remember this when making your own. Consistency in color, typeface, and layout will help the infographic read as a whole. The visual identity of your brand will be strengthened as a result of this as well.
Not Defining a Clear Message
Best Infographics need to have a message or main point they are aiming to convey. The infographic’s presentation may seem haphazard and unfocused if there is no central point.
Ignoring Target Audience
Creating infographics without considering your audience is a huge mistake. Not knowing your audience could result in a poorly received infographic and a missed opportunity to convey crucial information.
Unauthentic Information
Failure to provide source information: It is important that infographics be based on credible and accurate sources. The reliability of the information offered and the infographic’s overall professionalism might be damaged by failing to provide appropriate citations.
Create infographics
Infographics are an amazing way for businesses to communicate their message concisely and visually. They can help create more engagement with customers and prospects, increase brand recognition and trust, and boost website traffic. By using infographics as part of your content marketing strategy, you can quickly become the go-to source for relevant information on your topic. With so many benefits to consider, it’s clear that investing in infographics is a great way to drive success for your business.
Hire the best infographics from Cloud Animations. We’ve a team of skillful designers that will take your business to the next level. Besides, we serve 2D/3D animation, whiteboard, logo animation, video editing, CGI and VFX, motion graphics, Hybrid and Cel.


