
Let’s be clear. The internet is a graveyard of boring content. We are drowning in a sea of static JPEG files, lifeless text blocks, and PDF “guides” that are just digital toast. Your audience is not bored, but they are conditioned. They have developed “scroll blindness” and can spot a valueless stock photo from a mile away.
So, how do you break through? You stop broadcasting at them and start building with them. This is the entire job of interactive graphics.
This is not just about making things move. This is about making things react. An interactive graphic is not a picture; it’s a tool. It’s a conversation. It’s a lean-forward experience in a lean-back world.
This guide will break down what interactive graphics are, why they work, and how they separate powerhouse brands from the digital noise.
What Are Interactive Graphics, Really?
This is the central question, so let’s nail it. The keyword What are interactive graphics gets tossed around a lot, often confused with simple animation.
Here is the technical yet straightforward definition: Interactive graphics are visual elements within a digital interface that respond to user input.
That’s it. The magic is in the response. The user must be able to do something like click, hover, scroll, drag, or type that causes the visual information to change, reveal, or be calculated.
- A static infographic is a poster. You look at it.
- A motion graphic is a video. You watch it.
- An interactive graphic is a machine. You use it.
This fundamental difference shifts the user from a passive consumer to an active participant. This single shift is the most valuable currency on the modern web. It is the C-suite of user engagement, leveraging basic human curiosity to pull your audience deeper into your story.
The Big Payoff: Advantages of Interactive Graphics
Why go through the trouble? Because the pros of interactive graphics are not just minor “nice-to-haves.” They are fundamental, bottom-line business drivers. This is where your marketing team should be taking notes. Here are the hard advantages of interactive graphics:
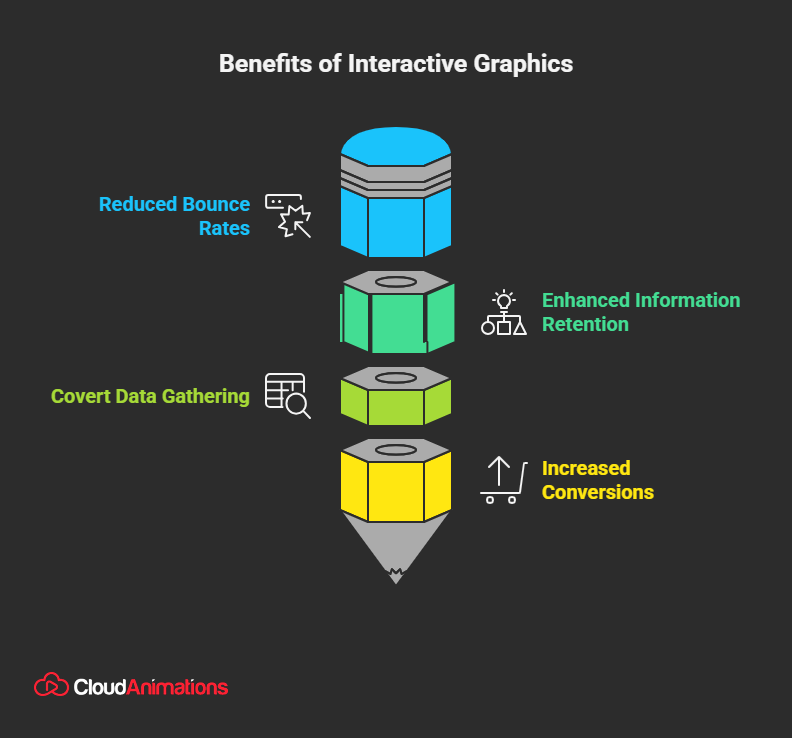
1. They Obliterate Bounce Rates
The average time on a webpage is often measured in seconds. Users scan for value and bolt. Interactive graphics are a pattern-interrupt. They are a hook. When a user sees a slider, a clickable map, or a “Start Quiz” button, their curiosity is triggered. This alone can keep them on your page, dramatically increasing session duration and signaling to Google that your content is valuable.
2. They Supercharge Information Retention
Remember high school science? You likely forgot the textbook chapters, but you remember the one time you got to mix the chemicals yourself. This is the “Cone of Experience,” a concept by educator Edgar Dale. We remember:
- 10% of what we read
- 20% of what we hear
- …but 90% of what we do.
When a user clicks to reveal data, drags a slider to see a “before and after,” or answers a quiz question, they are doing so. The information is not just passively consumed; it’s actively discovered. This makes your message stick.
3. They Are Covert Data-Gathering Tools
This is the genius-level marketing secret. Interactive graphics are not just for the user; they are for you.
- That quiz? It’s a powerful market segmentation tool. Every answer (e.g., “What’s your biggest business challenge?”) is a data point that helps you qualify that lead.
- That ROI calculator? It tells you exactly what pain point your user has and what their budget might be.
- That interactive map? It shows you which geographic regions are most interested in your services.
You are providing genuine value (an answer, a calculation) in exchange for priceless, zero-party data.
4. They Generate Higher Conversions
The data backs this up. According to statistics from the Content Marketing Institute, 81% of marketers agree that interactive content is more effective at grabbing attention than static content. Other studies show that interactive content can generate twice as many conversions as passive content. Why? It builds a micro-commitment.
A user who has spent two minutes engaging with your calculator is far more invested and more likely to take the next step than someone who just scanned a list of bullet points.
Is Your Data Just Lying There?
You have powerful data. You have a complex story. Right now, it’s probably trapped in a static PDF or a boring “About Us” page. That’s not content; it’s a missed opportunity. At Cloud Animations, we are masters of data storytelling. We can help you transform your flat data into compelling, interactive graphics that your audience will not just see, but experience.
The Blueprint: Conceptual Framework for Interactive Graphics
This sounds academic, but the conceptual framework for interactive graphics is a simple, two-part system. It’s an “if-then” statement for design.
Part 1: The User Input (The “If”) This is the action the user performs. The “verb.”
- Hover: Moving the mouse over an element.
- Click/Tap: The most direct command.
- Scroll: Using the scroll wheel or swiping.
- Drag: Clicking and holding to move an element.
- Input: Typing text or numbers into a field.
- Filter/Toggle: Clicking a button to change a data set.
Part 2: The System Response (The “Then”) This is the graphic’s reaction. This is your “noun.”
- Reveal: Hidden interactive information appears. (e.g., hovering over a country shows its stats).
- Animate: The graphic moves. (e.g., clicking a button causes a bar chart to grow).
- Filter: The data set changes. (e.g., toggling “2024” hides all other years on a chart).
- Calculate: The graphic returns a new value. (e.g., an ROI calculator shows a result after you input data).
- Navigate: The user is moved to a new “state” or view within the graphic.
A great interactive graphic seamlessly pairs a simple input with a rewarding response. The design challenge is to make the input obvious and the response instant and valuable.
The Cons of Interactive Graphics
It’s not all sunshine and conversion rates. An EEAT-focused (Expertise, Authoritativeness, Trustworthiness) approach demands honesty. Here are the cons of interactive graphics you must consider before you dive in.
- Cost: This is the big one. A powerful interactive graphic is not a 5-minute job in a drag-and-drop builder. It requires a specialist team: a UI/UX designer, a developer (often with JavaScript experience) to code the logic, and a strategist to map the user journey. It is an investment.
- Time: Unlike a blog post, you cannot spin up a complex interactive data visualization in an afternoon. The process involves strategy, wireframing, design, development, testing, and debugging. This can take weeks or even months.
- Performance & Optimization: A clunky, slow-loading, or buggy interactive piece is worse than a simple static image. It breaks user trust and destroys professionalism. These graphics must be ruthlessly optimized for mobile devices and different browsers, which adds to the technical overhead.

Mark Wilson
Mark is a Senior Content Marketer with 7+ years of experience in growing B2B, B2C, e-commerce, SaaS, & Digital Design Brands. He’s a polished writer, SEO geek, optimist at heart & good at playing table tennis.
Get the week’s best
marketing content

Killer Interactive Graphics Examples (And Why They Win)
Talk is cheap. Let’s look at the real world. You have seen these, even if you did not know what to call them. Here are a few common examples of interactive graphics.
1. Interactive Infographics
This is the most direct evolution of a static JPEG. The keyword “interactive infographics” describes content that uses the user’s scroll to trigger animations and reveal data. Instead of a 10,000-pixel-long image that you just drift past, every scroll depth reveals a new chapter, a new stat, a new animation.
Why it wins: It turns a list of facts into a story. It builds momentum and uses the scroll (an action everyone is already doing) as the engine for the experience. The New York Times and The Pudding are undisputed masters of this “scrollytelling” format.
2. Calculators and Quizzes
This is the most common and effective example of interactive graphics for marketing.
- Real Estate Website: “How Much House Can You Afford?” calculator.
- SaaS Company: “What’s Your Team’s Productivity Score?” quiz.
- Bank: “Retirement Savings Calculator.”
- Why it wins: It provides instant, personal value. The user inputs their own data and gets a custom-tailored, relevant answer. This is not generic advice; it’s a solution. And as we discussed, it’s a brilliant way to capture qualified leads.
3. Interactive Maps and Data Visualizations
This is where interactive graphics go from content to tool. Imagine a global map of your company’s sales data.
- Static Version: A confusing map with 500 dots on it.
- Interactive Version: A clean map. The user can hover over a region to view a summary, click a country to view detailed stats, or use a slider to view sales growth over time.
- Why it wins: It empowers the user to explore complex data on their own terms. They can filter out the noise and find the one piece of information they care about. This is the peak of data-driven authority.
Don’t Just Show. Guide.
A static bar chart is just a set of numbers. An interactive chart is the answer. A static map is just geography. An interactive map is a territory. Which would you rather give your customers? Which one proves your expertise?
At our motion graphics company, we specialize in building these exact tools. We can help you create interactive calculators, product demos, and data visualizations. Ready to Build Your Interactive Tool? Talk to Our Team.
Interactive Graphics vs. Motion Graphics: A Key Distinction
This is a critical point of confusion, especially for a brand like Cloud Animations. Many people use the terms interchangeably. They are not the same.
Motion Graphics (A “Lean Back” Experience)
- What it is: An animation. An explainer video. A logo reveal.
- User Role: Passive. The user presses “play” and watches.
- Data Flow: One-way. The brand delivers a pre-packaged, linear story to the user.
- Best for: Telling a linear story, explaining a single concept, and building brand emotion.
Interactive Graphics (A “Lean Forward” Experience)
- What it is: A tool. A calculator. A filterable map.
- User Role: Active. The user is in control. They click, drag, and explore.
- Data Flow: Two-way. The user makes a request (a click), and the system delivers a custom response.
- Best for: Allowing data exploration, providing personalized answers, and capturing user data.
| Feature | Motion Graphics (e.g., Explainer Video) | Interactive Graphics (e.g., Data Viz) |
| User Role | Passive (Viewer) | Active (Participant) |
| Primary Goal | Tell a linear story, explain a concept. | Allow exploration, provide custom data. |
| Data Flow | One-way (Brand to User) | Two-way (User to Brand and back) |
| Core Skill | Animation, Storytelling, Pacing | UI/UX Design, Development, Data Structuring |
One is not better than the other. They are different tools for different jobs. A great brand strategy often uses both.
The Future Is Not Static
The web is not a book. It was not built to be a static, one-way broadcast. It was built for interaction. For the last 20 years, we have just been lazy.
But the audience has caught up. They expect more. They demand engagement. Static content is a monologue. Interactive graphics are the start of a conversation.
This is a fundamental shift in how we must think about content. It’s about respecting your users’ intelligence, rewarding their curiosity, and having the confidence to let them lead the discovery. The question is no longer “Can we make this?” The question is “Why would we make anything else?”
Get your Free 30 Minute strategy
session with an experienced digital animators
You Might Also Like

How Explainer Videos Help Businesses?

The Role of AR/VR in Interactive Storytelling for Children
Why Explainer Videos Are a Must-Have for B2C Sales?

Why Explainer Videos Are Effective?

Why Are Creative Explainer Videos for Internal Business Training and Communication Effective?

How Product Explainer Videos Boost Sales and Customer Understanding?

How AI Explainer Videos Are Transforming Complex Concepts into Simple Ideas Creative

What is the Role of Corporate Explainer Videos in Onboarding and Training?

Why Whiteboard Explainer Videos Are Perfect for Complex Ideas?

How do you find the best studio at low costs for explainer videos in the USA?
Give us your e-mail so
we can give you Update